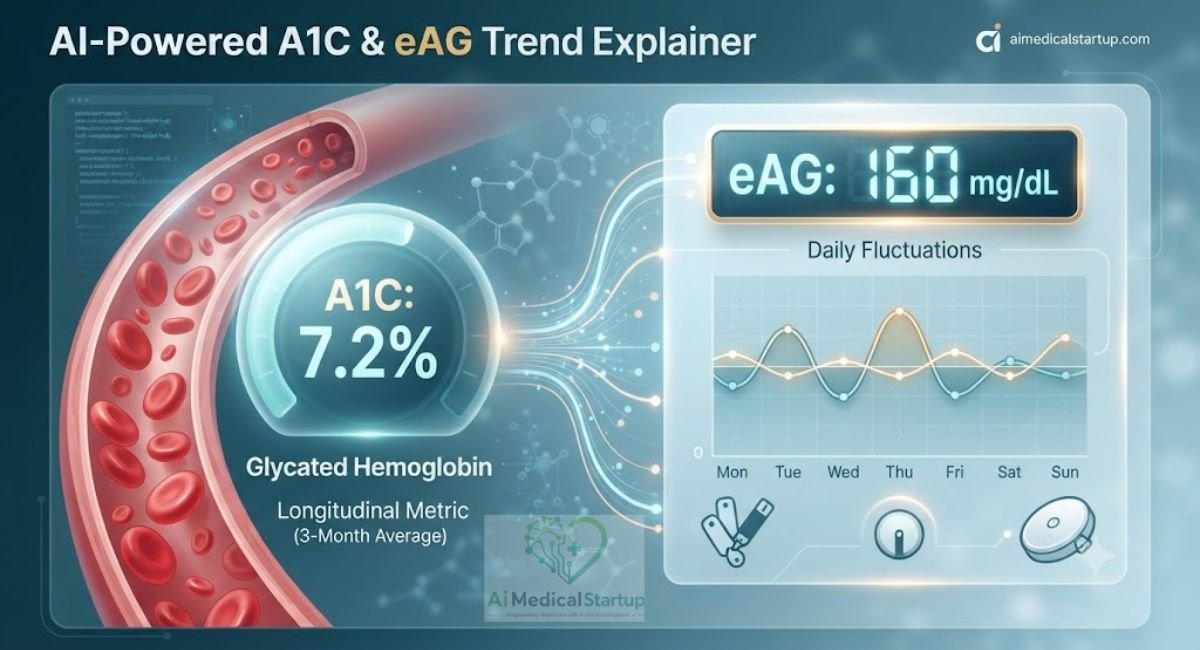
AI-Powered A1C & eAG Trend Explainer

AI-Powered A1C & eAG Trend Explainer
Convert A1C and estimated average glucose (eAG), review results in context, and save past A1C results to compare trends across visits.
Interactive Calculator
Clinical interpretation
This educational tool does not diagnose diabetes or replace advice from a qualified healthcare professional.
Longitudinal Progress Tracker
Save previous A1C results to review changes over time in this browser session.
| Date | A1C | eAG | Status | Actions |
|---|---|---|---|---|
| No historical records saved yet. Add a past lab date and A1C value above. | ||||
Platform & Solution Evaluation Matrix
Example considerations for evaluating digital A1C and eAG tools in a healthcare workflow.
| Evaluation metric | Traditional manual lookup | Digital calculator workflow |
|---|---|---|
| Conversion workflow | Formula references or manual calculation | Automated two-way A1C and eAG conversion |
| Trend review | Paper records or spreadsheet tracking | Structured entry and chronological history review |
| Interoperability planning | Often disconnected from clinical systems | Can be designed for standards-based integration, where applicable |
| Privacy and security | Depends on storage and workflow controls | Requires appropriate privacy, security, and legal review before clinical use |
| Developer readiness | Limited automation options | Potential for API-based or embedded workflows, if implemented |
| Startup evaluation | Low technical complexity, limited scalability | Assess validation, governance, integration, and operational readiness |
Understanding the Science: How A1C Connects to Daily Glucose
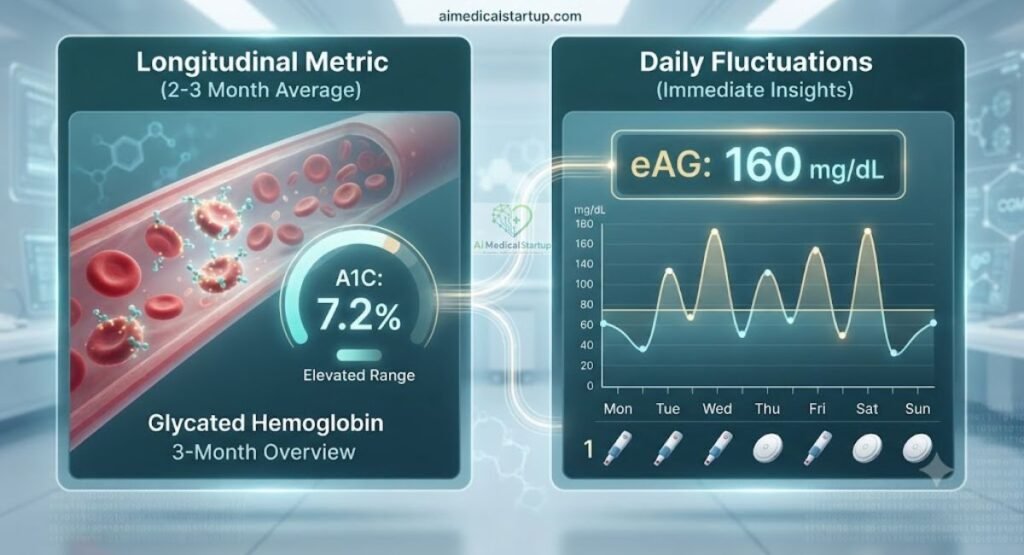
When patients receive a routine lab result, they are often greeted with an A1C percentage ( glycated hemoglobin). While clinicians rely heavily on this metric to assess long-term glycemic control over a 2 to 3-month window, it can feel abstract to patients accustomed to checking daily finger-sticks or continuous glucose monitor (CGM) readings in mg/dL.
This is where the Estimated Average Glucose (eAG) metric bridges the gap. By translating a percentage into a familiar daily average, patients and healthcare providers can better align lifestyle modifications with laboratory targets.
The Mathematical Foundation: The ADA Formula
The conversion between A1C and eAG is rooted in the landmark A1C-Derived Average Glucose (ADAG) study, supported by the American Diabetes Association (ADA). The mathematical relationship is expressed through a linear regression formula:
- From A1C to eAG:$eAG = 28.7 \times A1C - 46.7$
- From eAG to A1C:$A1C = \frac{eAG + 46.7}{28.7}$
For example, if a patient has an A1C of 7.0%, the calculation yields:
$$eAG = (28.7 \times 7.0) - 46.7 = 154.2 \text{ mg/dL}$$
This tells the patient that their average blood glucose over the past few months has hovered around 154 mg/dL, making clinical discussions far more actionable than looking at percentage points alone.
A1C to eAG Run Sequence Plot
Explore how small changes in A1C correspond with estimated average glucose (eAG). Move the slider to review seven nearby A1C values and their calculated eAG results.
A1C to estimated average glucose sequence calculator
The chart displays the selected value plus three adjacent values on either side, where available.
Estimated average glucose sequence
Seven results centered around an A1C value of 7.0%.
| Step | A1C | Calculated eAG | General range |
|---|
Clinical Ranges and Risk Stratification
To ensure safe interpretation, standardized medical thresholds guide the AI-driven insights.
Understand Your A1C Result & eAG Level
Use our interactive A1C to eAG converter and trend explainer to evaluate how your A1C result compares with standard clinical ranges.
This educational tool does not diagnose diabetes. Discuss your laboratory results with a qualified healthcare professional.
Note on eAG: Estimated average glucose (eAG) is calculated from A1C values to help translate long-term control into daily metrics. It may vary from individual continuous glucose monitor (CGM) or fingerstick meters. The ADA recognizes 6.5% as the diagnostic threshold.
Normal range
Below 5.7% A1C | eAG under 117 mg/dL
Generally associated with lower risk of metabolic complications. Maintain regular wellness and preventive care guidelines.
Prediabetes range
5.7%–6.4% A1C | eAG 117–139 mg/dL
Indicates an increased risk for type 2 diabetes. Speak with a clinical professional regarding lifestyle, nutrition, and tracking.
Diabetes threshold range
6.5% A1C or higher | eAG 140 mg/dL or higher
Falls within diagnostic parameters. A healthcare provider should interpret your lab panel and confirm next clinical steps.
Why Healthcare Startups Are Integrating Dynamic Explanations
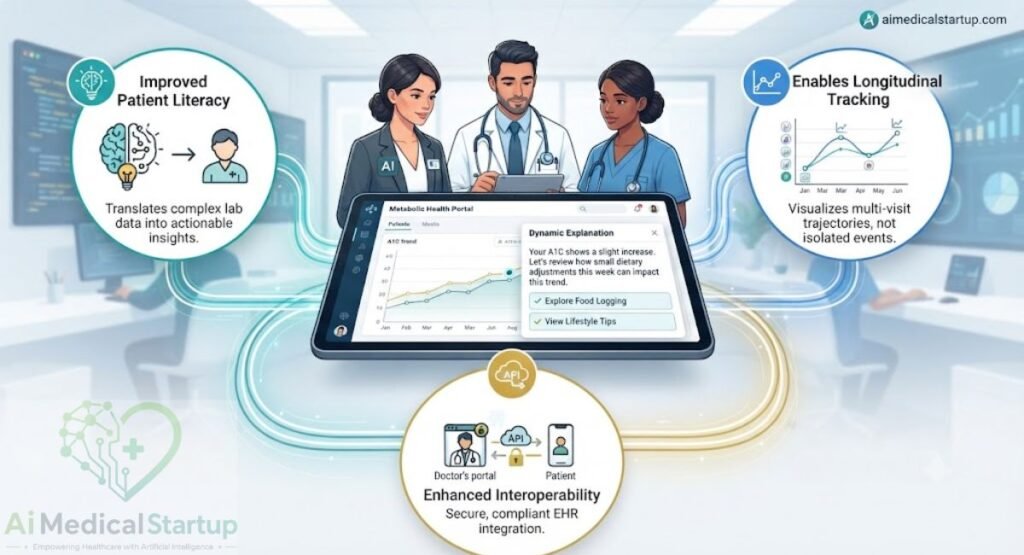
Traditional health portals often present raw lab values in isolated, static tables accompanied by generic reference ranges. By embedding interactive, intelligent tools directly into clinical workflows, digital health startups can:
Improve Patient Literacy
Transform complex clinical data into plain-language summaries that foster better health autonomy.
Enable Longitudinal Tracking
Allow users to visualize multi-visit trajectories rather than reacting to single, isolated lab events.
Enhance Interoperability
Leverage FHIR-compliant architectures to securely sync lab trends directly into electronic health record (EHR) pipelines while maintaining strict client-side data privacy.
Frequently Asked Questions
Clear, clinically reviewed answers regarding A1C, eAG calculations, and digital health integration for patients and developers.
A1C measures the percentage of hemoglobin coated with sugar, reflecting your average blood glucose over the past 2 to 3 months. eAG (Estimated Average Glucose) translates that percentage into the exact same units (mg/dL or mmol/L) that you see on daily finger-stick meters or continuous glucose monitors (CGMs), making your lab results much easier to relate to day-to-day habits.
The conversion relies on the landmark international A1C-Derived Average Glucose (ADAG) study backed by the American Diabetes Association (ADA). While it provides a highly reliable mathematical estimate, individual factors such as red blood cell turnover rates, anemia, or hemoglobin variants can sometimes cause minor discrepancies between eAG and actual CGM averages.
Yes. Our client-side calculation and local storage architecture ensure that user input values are processed securely within the browser without transmitting unencrypted protected health information (PHI) to external tracking servers. For enterprise deployments, our API integrations adhere fully to HIPAA, GDPR, and FHIR interoperability security standards.
Definitely. Digital health developers and health tech startups can leverage our modular widgets and RESTful API endpoints. The system is designed to support HL7 FHIR standards, allowing seamless embedding into patient portals and clinical workflow dashboards.
Key Takeaways
Essential clinical insights and technical takeaways for healthcare professionals, patients, and digital health developers.
Instant Bidirectional Conversion
Seamlessly translate between A1C percentages and estimated average glucose (eAG mg/dL) using standard American Diabetes Association regression formulas.
Longitudinal Trajectory Tracking
Move beyond static lab results by logging historical check-ins to monitor long-term glycemic progress, metabolic trends, and lifestyle intervention impacts.
HIPAA & GDPR Privacy Standards
Built with client-side calculation security and local storage execution, ensuring protected health information (PHI) remains secure and compliant.
EHR & FHIR API Integration Ready
Designed for healthcare startups seeking modular widgets or scalable REST APIs to embed intelligent metabolic tools directly into patient portals and clinical workflows.


Dr. Kanza Sarfraz, M.B.B.S., is a medical doctor and graduate of Allama Iqbal Medical College, Lahore. She brings nearly seven years of clinical experience across tertiary-care hospitals, medical headquarters, and healthcare facilities in both the public and private sectors. Her clinical experience provides a practical perspective on healthcare delivery, emerging medical technologies, and the evolving role of artificial intelligence in medicine.